
A Meta ad campaign can look wildly profitable inside a seven-day click attribution window while quietly burning enterprise value. Platform dashboards reward first-order impulse buys, masking the reality that the average ecommerce repeat purchase rate sits at just 28.2%, according to 2026 data published by Propel. If your unit economics rely on second-order margin to pay off Day 0 acquisition costs, watching blended metrics inside Shopify will not save your bottom line.
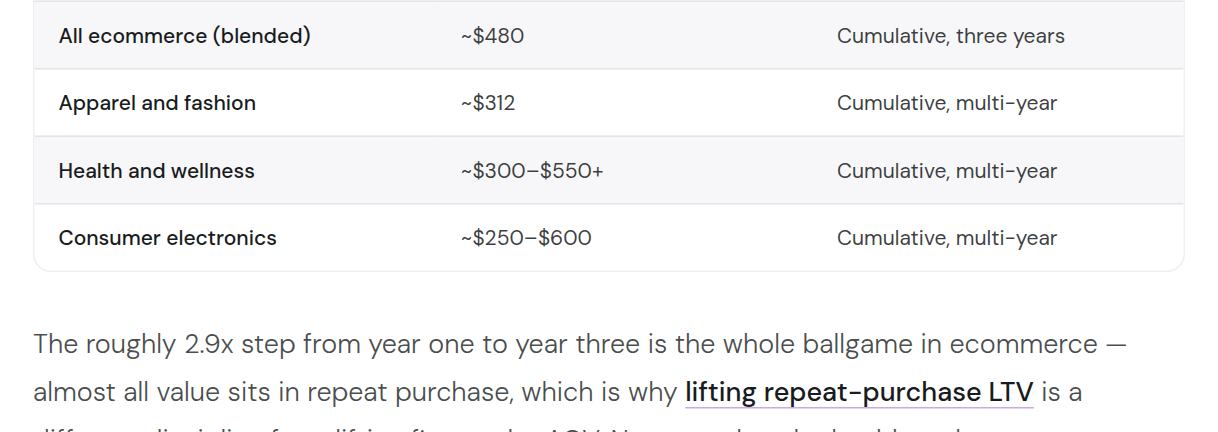
Data compiled by Perspective AI shows that ecommerce brands average approximately $168 in customer value during year one, crawling to a cumulative $480 over three years. The brands surviving rising ad costs are not praying for organic repurchases at month twelve; they deliberately architect cash collection between Day 30 and Day 90. Engineering this curve requires ditching generic email calendars and treating retention as a cold, data-backed feedback loop tied directly to media spend.
The Day 90 Decay: Why Dashboard ROAS Lies
Attribution windows in Meta Ads Manager and Google Ads are designed to make media buyers feel safe. They optimize for top-of-funnel actions within one to seven days. However, as Churney points out in its cohort economics analysis, platform dashboards showcase attributed ROAS inside an artificial micro-window, whereas cohort LTV reveals what genuinely happens to buyers after the conversion event. A campaign selling a heavily discounted introductory SKU might post a 3.5x in-platform ROAS, yet yield an atrocious 90-day repurchase rate of under 8%.
As Saras Analytics notes, customer acquisition cost is no longer a simple media metric; it is an output of your overall data maturity. Relying on siloed platform metrics causes DTC operators to pour budget into channels that acquire single-transaction shoppers who actively churn out before offsetting their media acquisition cost.
Platform dashboards show attributed ROAS inside a short optimization window, but cohort LTV shows what actually happened to customers after the click.
Consider the math published by Digital Applied in their 2026 CLV benchmarks: the top quartile of DTC brands separate themselves not on Day 1 margin, but on how fast their cumulative cohort curve inflects before month four. If your Day 90 cohort gross margin cannot absorb your fully loaded acquisition costs (ad spend, pick-pack-fee, merchant processing, and COGS), scaling paid ad spend from $20K/month to $100K/month merely accelerates cash insolvency.
The Cohort Velocity Framework: Engineering the Day 15 to Day 90 Window
To eliminate reliance on generic retention tactics, we use a repeatable, four-phase system designed to compress repurchase latency: The Cohort Velocity Framework. It organizes post-purchase triggers based on real usage timelines rather than arbitrary calendar broadcasts.
- Phase 1: Consumption Validation (Days 1–14). Before attempting an upsell, confirm delivery and guide product usage. Ringly reports that automated post-purchase emails reduce 90-day churn by 14%, while first-time buyers receiving personalized onboarding communications demonstrate a 45% higher second-purchase rate. Use this window strictly to prevent buyer remorse and ensure correct daily usage.
- Phase 2: Predictive Depletion Intervention (Days 15–30). Analyze average product depletion velocity. If an SKU lasts 30 days on average, initiate replenishment or complementary SKU recommendations at Day 21, not Day 35 when the customer has already formed a new habit without your product.
- Phase 3: The Cross-Category Threshold (Days 31–60). Customers who purchase across two distinct merchandise categories churn at dramatically lower rates than single-category buyers. Deploy SMS and email flows triggered via webhook that introduce adjacent product lines tailored to the initial acquisition angle.
- Phase 4: Day 90 Churn Reversal (Days 61–90). At Day 75, non-replenished profiles are routed into a dedicated dynamic re-engagement bucket. Instead of deep discounting, offer educational bundling or exclusive access to limited-edition variations to protect brand equity.

Spend-Tier Architecture: Scaling Retention Across Revenue Bands
Retention infrastructure must scale alongside your paid acquisition volume. Implementing enterprise data stacks prematurely drains working capital, while running early-stage setups at scale leaves six figures on the table.
For Emerging Brands Spending $10K to $30K/Month
At this volume, avoid high-overhead enterprise software. Analytics tools like RetentionX or Peel Insights—which run roughly $500 per month—often provide more granularity than a brand with low transaction volume can operationally action. Instead, run your cohort analysis inside Shopify’s native Customer Cohort report, which groups retention by first-purchase month.
Pair Shopify’s core reporting with Klaviyo for flow execution and Make for simple data syncs. Focus your creative energy on dialing in two high-impact flows: a tight 3-part onboarding sequence and a single predictive replenishment trigger. Do not worry about cross-channel ad retargeting for past purchasers; dedicate your scarce capital to top-of-funnel validation.
For Growth Brands Spending $35K to $70K/Month
At this intermediate tier, basic out-of-the-box Shopify cohort views begin obscuring channel-level discrepancies. A blended 28% repeat rate often hides that your Google Search brand campaigns retain at 42% while Meta broad campaigns retain at 16%. Transition to dedicated cohort trackers such as Triple Whale or Lifetimely (roughly $300/month) to split cohort retention curves by initial acquisition channel and landing page angle.
Implement two-way syncs between your ESP and Shopify to track SKU-level repurchases. If a customer acquired on SKU-A rarely buys SKU-B within 60 days, stop cross-selling SKU-B; route them to travel-size variants or consumable refills of SKU-A instead. Automate customer health scoring so that declining engagement triggers automated SMS check-ins prior to Day 60.
For Scale Brands Spending $75K to $150K+/Month
At six-figure monthly spends, standard third-party tools fall short because they struggle to blend fully loaded operational variables (custom shipping surcharges, variable payment gateway fees, and returns) to compute true net-margin CAC, a point emphasized by Definite.app. Brands at this level must track cohort contribution margin across acquisition channels using unified internal data warehouses.
We build our operations on an internal n8n engine connected to Claude and Gemini APIs. For advanced brands, this setup monitors daily cohort cohorts, scores customer churn probability via Python scripts, and programmatically populates dynamic custom audiences inside Meta Advantage+ catalog campaigns to reactivate dormant buyers before Day 90 without human latency.
Retention Leaks to Cut Immediately
Most ecommerce retention playbooks are bloated with low-ROI distractions. Cut these three time-sinks immediately:
- Stop Sending Blanket 20% Off Blast Emails: Blasting your entire unsegmented list every Tuesday trains high-intent repeat buyers to wait for discounts, eroding your gross margin on customers who would have paid full price.
- Abandon Complex Tiered Loyalty Programs Too Early: Complex point systems require substantial engineering overhead and rarely drive incrementality for brands doing under $5M in GMV. Customers care about immediate utility, reliable replenishment, and product efficacy—not accumulating points they forget to redeem.
- Ignore Standalone Subscription Boxes if Churn Exceeds 10%: Recurly benchmark data shows subscription boxes frequently lose 10% to 15% of their subscriber base every month. Forcing a recurring subscription model on a customer base that prefers frictionless re-ordering will skyrocket Day 60 churn. Offer frictionless one-click re-order portals instead.

The Day 90 Cohort Health Audit: Worked Calculation
Here is an operational teardown to calculate whether a cohort is financially viable by Day 90. We compare two distinct operating profiles: a standard consumable brand with an unoptimized post-purchase experience versus an optimized brand executing the Cohort Velocity Framework. Both models assume an initial acquisition cohort of 1,000 customers at a $42.00 blended CAC ($42,000 total ad outlay) and a 50% baseline product gross margin.
Model A: Unoptimized Post-Purchase Funnel
In this baseline scenario, the brand relies on standard broadcast emails and generic 30-day blast campaigns without personalized usage onboarding:
| Phase | Timeline | Conversion Rate | AOV | Gross Margin | Cumulative Cohort Net Profit |
|---|---|---|---|---|---|
| Initial Acquisition | Day 0 | 100.0% (1,000 orders) | $60.00 | 50% ($30.00 GP/order) | -$12,000 (after $42,000 blended CAC) |
| Phases 1 & 2 (Broadcast Promos) | Days 1–30 | 9.0% (90 repeat orders) | $52.00 | 50% ($26.00 GP/order) | -$9,660 (+$2,340 phase GP) |
| Phase 3 (Generic Discount Blasts) | Days 31–60 | 7.0% (70 repeat orders) | $50.00 | 45% ($22.50 GP/order) | -$8,085 (+$1,575 phase GP) |
| Phase 4 (Passive Replenishment) | Days 61–90 | 3.0% (30 repeat orders) | $55.00 | 50% ($27.50 GP/order) | -$7,260 (+$825 phase GP) |
At Day 90, the unoptimized brand has generated only $34,740 in cumulative gross profit against their $42,000 initial spend. The cohort remains $7,260 in the red, requiring another five to six months of organic trickle to break even on cash.
Model B: Optimized Cohort Velocity Execution
By comparison, this brand integrates delivery tracking triggers, predictive replenishment at Day 21, and algorithmic cross-category recommendations at Day 45:
| Phase | Timeline | Conversion Rate | AOV | Gross Margin | Cumulative Cohort Net Profit |
|---|---|---|---|---|---|
| Initial Acquisition | Day 0 | 100.0% (1,000 orders) | $60.00 | 50% ($30.00 GP/order) | -$12,000 (after $42,000 blended CAC) |
| Phases 1 & 2 (Onboarding & Depletion) | Days 1–30 | 16.0% (160 repeat orders) | $55.00 | 50% ($27.50 GP/order) | -$7,600 (+$4,400 phase GP) |
| Phase 3 (Cross-Category Lift) | Days 31–60 | 14.0% (140 repeat orders) | $65.00 | 50% ($32.50 GP/order) | -$3,050 (+$4,550 phase GP) |
| Phase 4 (Replenishment Cycle) | Days 61–90 | 4.0% (40 repeat orders) | $80.00 | 50% ($40.00 GP/order) | -$1,450 (+$1,600 phase GP) |
Total cumulative gross profit collected reaches $40,550 against the $42,000 initial media spend, bringing the cohort to near-breakeven by Day 90 and fully profitable by Day 105. Without Phases 2 through 4, this cohort would remain deep in the red indefinitely.
The 5-Step Cohort Velocity Implementation Checklist
To implement this retention model across your store within 14 days, follow this sequential deployment roadmap:
- Audit Consumption Windows: Survey 100 recent purchasers or examine warehouse fulfillment logs to identify the exact day customers unbox and finish their initial supply. Set your replenishment triggers three days prior to this median threshold.
- Configure Zero-Discount Onboarding: Replace immediate post-purchase coupon sequences with instructional video content and dosage guidelines. Target a 60%+ open rate on email one to establish sender reputation and secure product compliance.
- Isolate Gateway SKUs: Filter cohort retention data in Shopify or Triple Whale by first-purchased item. Identify which front-end products drive the highest Day 90 repeat rates, and reallocate top-of-funnel ad spend specifically to those entry offers.
- Construct Cross-Category Sequences: Map out logical product pairing paths. If a customer purchases a core cleansing oil, trigger dynamic recommendations for daily moisturizers at Day 35 rather than redundant cleansers.
- Automate Paid Syncs for At-Risk Customers: Use Klaviyo or n8n to sync non-repurchasing segments at Day 65 into a Meta Custom Audience, serving founder-led educational video ads to re-ignite purchase intent before habit extinction occurs.
If your cohort curves flatline after Day 30, paid media scale is mathematically throttled. Execute systematic post-purchase communications, track cohort contribution margins ruthlessly, and optimize your media mix around buyers who actually stick.
Ready to apply this to your brand? Book your free creative audit at dreamfoxverse.com/free-audit/.